The Ya Ha Tinda elk monitoring project is one of the longest-running elk studies in the world. Since 2000, a collaborative research program has been on-going between researchers at the Universities of Alberta and Montana, Parks Canada, Alberta Conservation Association, Alberta Sport, Recreation, Parks and Wildlife, and other natural resource groups within Alberta to investigate factors influencing the herd’s dynamics such as: human impact (harvest, recreation, habitat management), natural factors (predation, climate), and natural vegetation dynamics .
In addition, Alberta Fish and Wildlife has been conducting aerial surveys of the herd starting in the 1970s to document the herd’s population dynamics. In the early 2000s, Leslie McInenly, MSc., and Dr. Mark Hebblewhite (now University of Montana), became the first students to work at YHT, and since then many master’s and doctorate students have continued the various components of this long-term research.
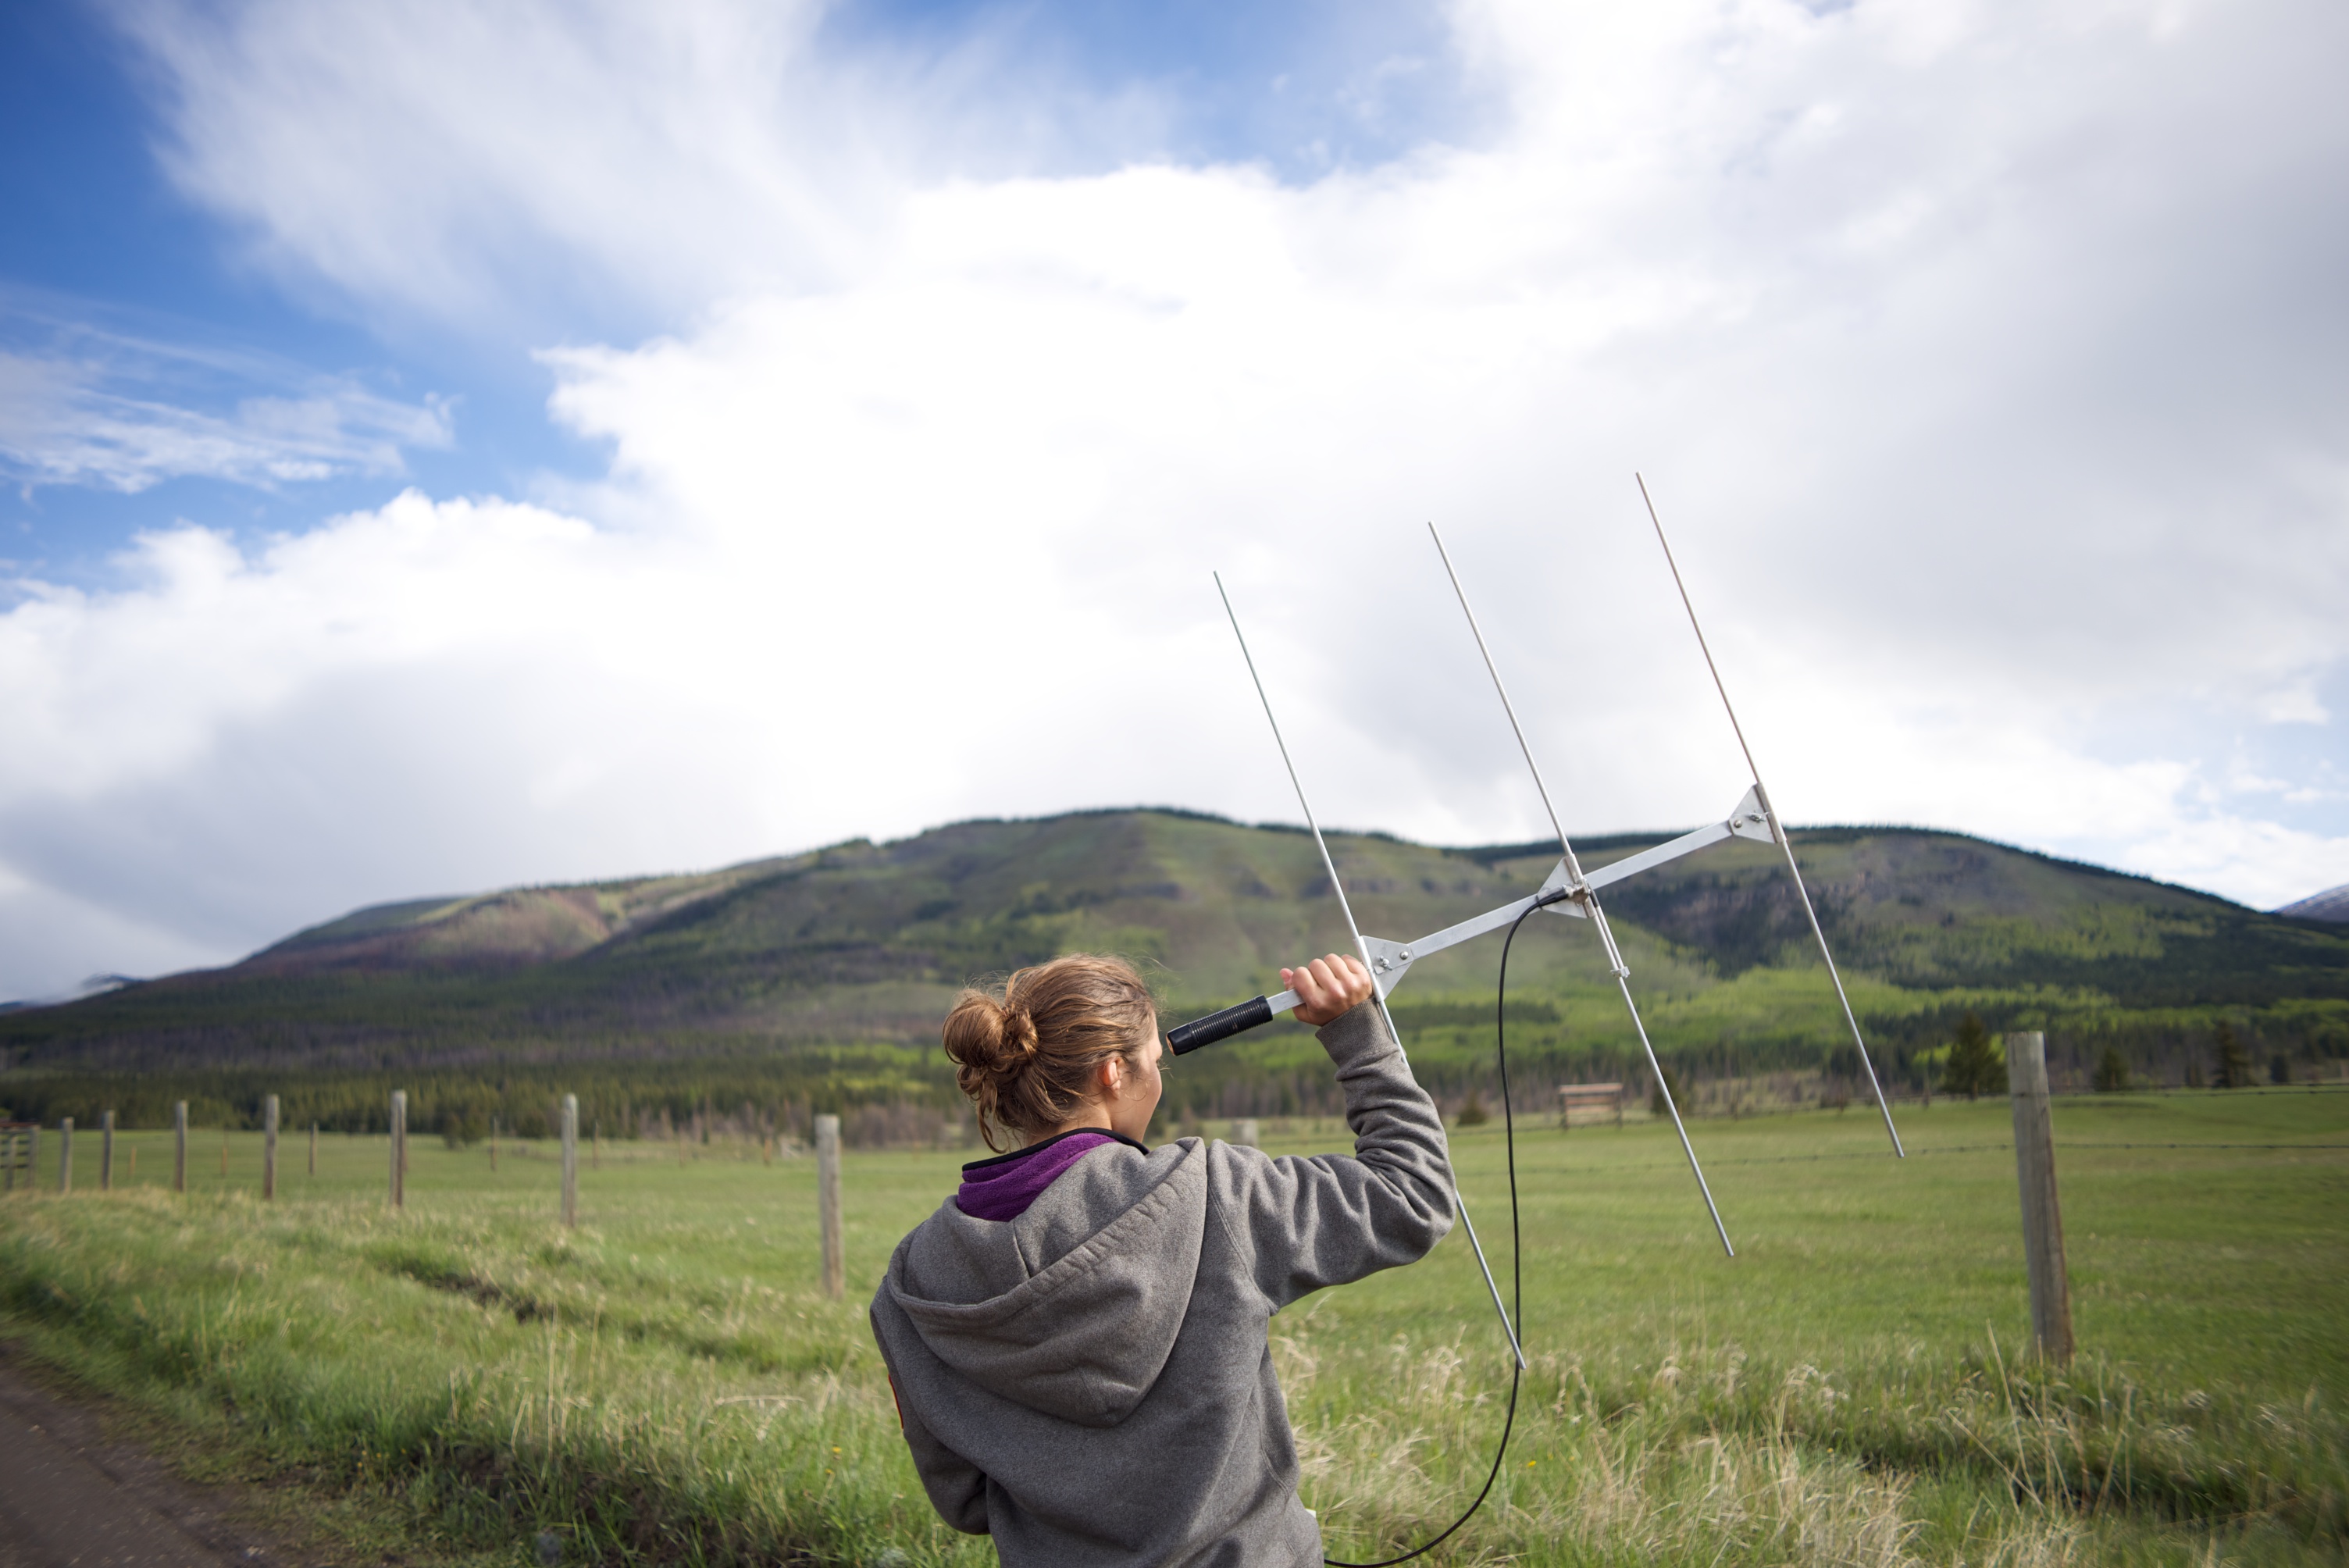
The Ya Ha Tinda elk are captured in a corral trap or darted from the ground and equipped with Very High Frequency (VHF) or Global Positioning System (GPS) collars (these collars take and store GPS locations on a regular basis). All elk receive unique ear tags to facilitate identification. The collars allow researchers to monitor the elk from a distance and to record their movements and any mortality events. Elk collars usually emit signals of 38 to 60 pulses per minute. When a collar stays immobile for more than 8 hours, the signal changes to 80 pulses per minute. Sometimes elk drop their collars but most of the time following this signal leads to a carcass.
During mortality investigations, researchers look for evidence that aid in determining the cause of death, such as: wounds, punctures, signs of a chase, plucked hair, tracks or scats, presence of a collared predator in the vicinity, or unhealthy body condition of the elk. It is essential to investigate mortalities early on before it becomes really difficult to distinguish predation from scavenging events. Necropsies are conducted on suspicious deaths to look for bruises, hemorrhaging, abnormalities, and to take any useful samples. We also investigate un-collared elk mortalities. Data is thus available for every age class and gender and can be entered into population models to predict the status of the herd. Documenting mortalities provides information on habitats that may pose high predation risk for the elk, which age classes are the most vulnerable, major causes of death, human impacts, and seasonal patterns
We listen for collared elk on a daily basis and record their presence or absence from specific locations. Listening for elk everyday and during flights helps determine an individual’s migratory behavior. Ratios of residents to migrants can be obtained and changes in migratory trends examined. This method is also useful in documenting distribution of the elk.
We determine composition of elk groups that we observe. It is crucial to count how many animals are in each age class to to model the population dynamics over time.
Cow and calf pairs are also described to keep track of calf survival through the year. If there are more calves in groups right after calving and not that many in October, something is not right… Since 2009, recruitment of calves into the population has declined from a cow-calf ratio of 27% in 2009 to 17% in 2010 to 8% at the end of winter 2013. Monitoring of group size and composition continues in summer in Banff National Park, on the ranch, and in the eastern part of the study area. Summer 2013 results showed [see Calf survival article] that calf survival was way higher east of the ranch. Are cows not having many calves or are the calves dying early on? In addition, when migrants are back to the ranch in winter, we can compare how migrant calves survive on the ranch versus the resident calves.
Our research also looks into the effects of habitat on the YHT population. We follow the evolution of the grasslands. Elk diet is mostly composed of grass and a reduction of available forage impacts the elk population. In late July – early August, when the highest biomass of grass is produced on the ranch, teams sample plots throughout the grasslands. Vegetative species composition and dry weight of a clipped sample are recorded. Since the beginning of the vegetation monitoring, native Fescue grasses have declined and the grasslands are shrinking, suffering from encroaching shrublands and forests.
Finally, we conduct pellet plots twice a year: in the spring and in the fall. The spring data reflects the winter use of the ranch whereas the fall data displays the summer use. Researchers visit ~400 plots around the ranch in grasslands and in forests. At each plot they determine the number of elk, deer, and horse pellet groups. Results help understand the relative use of the ranch by those three ungulates over time. Hot spots of distribution are highlighted in response to time (year) and habitat modifications (burn, biomass growth).
Overall, by repeating our standardized measurements over the years, we have been able to document many patterns of the YHT herd and can begin to understand how elk react to changes in their environment. By recognizing these chain reactions, we can work towards efficient and proper management of the Ya Ha Tinda herd.

